Loading...
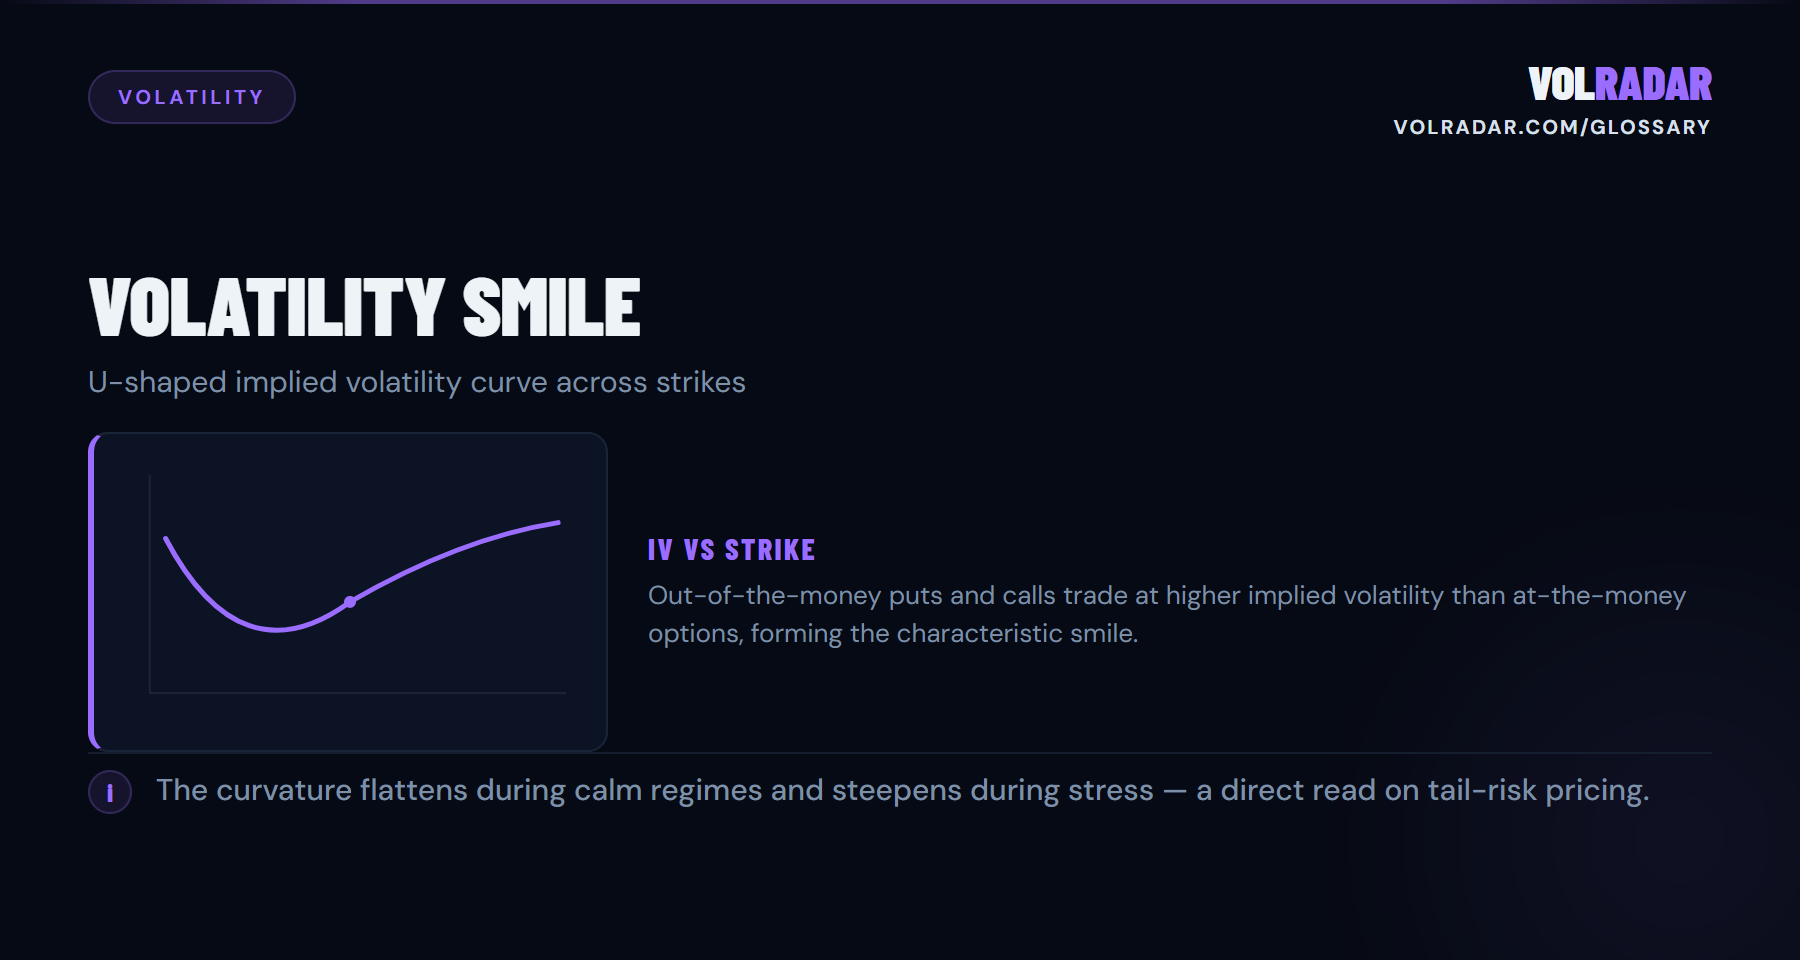
The U-shaped curve of implied volatility plotted across strikes at a single expiration. OTM puts and OTM calls trade at higher IV than ATM options, reflecting demand for tail protection and the limits of Black-Scholes' constant-vol assumption.
⚡
Key takeawayThe smile tells you where fear is concentrated. Steep put-side skew = strong downside hedging demand. A flattening smile signals complacency.
💡 Why It Matters
The smile reveals where the market prices fear. A steep put-side skew means traders are paying up for downside protection — rich premiums for put sellers but also a signal of perceived tail risk. Reading the smile is essential for understanding whether your OTM put premium is genuinely rich or fairly priced for the risk.
⚙ How It Works
Plot implied volatility on the Y-axis against strike price on the X-axis for a single expiration. ATM options sit at the bottom of the U-shape. Both OTM puts (left) and OTM calls (right) trade at higher IV. The put side is typically steeper in equity markets — this asymmetry is called skew.
📋 Example
SPY ATM IV is 16%. The 5% OTM put shows IV of 22%. The 5% OTM call shows IV of 17%. The put-side smile is 6 points steep; the call side only 1 point. This tells you: downside protection demand is 6x stronger than upside speculation demand.
⚠ Common Mistakes
Assuming the smile is static. It flattens during calm markets (complacency) and steepens during stress (fear). Also: comparing smile shapes across different underlyings without normalizing for moneyness — a $50 stock and a $500 stock have different strike spacing.
⚡ Volatility Smile in VolRadar
❓ FAQ
What is Volatility Smile?
The U-shaped curve of implied volatility plotted across strikes at a single expiration. OTM puts and OTM calls trade at higher IV than ATM options, reflecting demand for tail protection and the limits of Black-Scholes' constant-vol assumption.
Why does Volatility Smile matter for premium sellers?
The smile tells you where fear is concentrated. Steep put-side skew = strong downside hedging demand. A flattening smile signals complacency.
How does Volatility Smile work?
Plot implied volatility on the Y-axis against strike price on the X-axis for a single expiration. ATM options sit at the bottom of the U-shape. Both OTM puts (left) and OTM calls (right) trade at higher IV. The put side is typically steeper in equity markets — this asymmetry is called skew.
What are common mistakes with Volatility Smile?
Assuming the smile is static. It flattens during calm markets (complacency) and steepens during stress (fear). Also: comparing smile shapes across different underlyings without normalizing for moneyness — a $50 stock and a $500 stock have different strike spacing.
Related Terms
0DTE
Options expiring on the current trading day — zero days to expiration.
Backwardation
When near-term VIX exceeds longer-term VIX (VIX/VIX3M ratio above 1.0).
Block Trade
A block trade is a privately negotiated options transaction of at least 50 contracts (varies by exchange) that is executed off the public order book and then...
Charm Exposure
The aggregate delta decay across all options in a dealer hedging book.
This is not financial advice. Read our full investment disclaimer.