What is the RV Ratio?
The RV Ratio is a single number that expresses the relationship between realised and implied volatility as a ratio rather than a difference. VolRadar computes it as HV 20d (ORATS close-to-close) divided by IV 30d. A ratio of 0.80 means the stock's actual volatility is 80% of what options imply — the stock is moving 20% less than priced in. The ratio form makes it easy to compare across stocks with very different absolute IV levels.
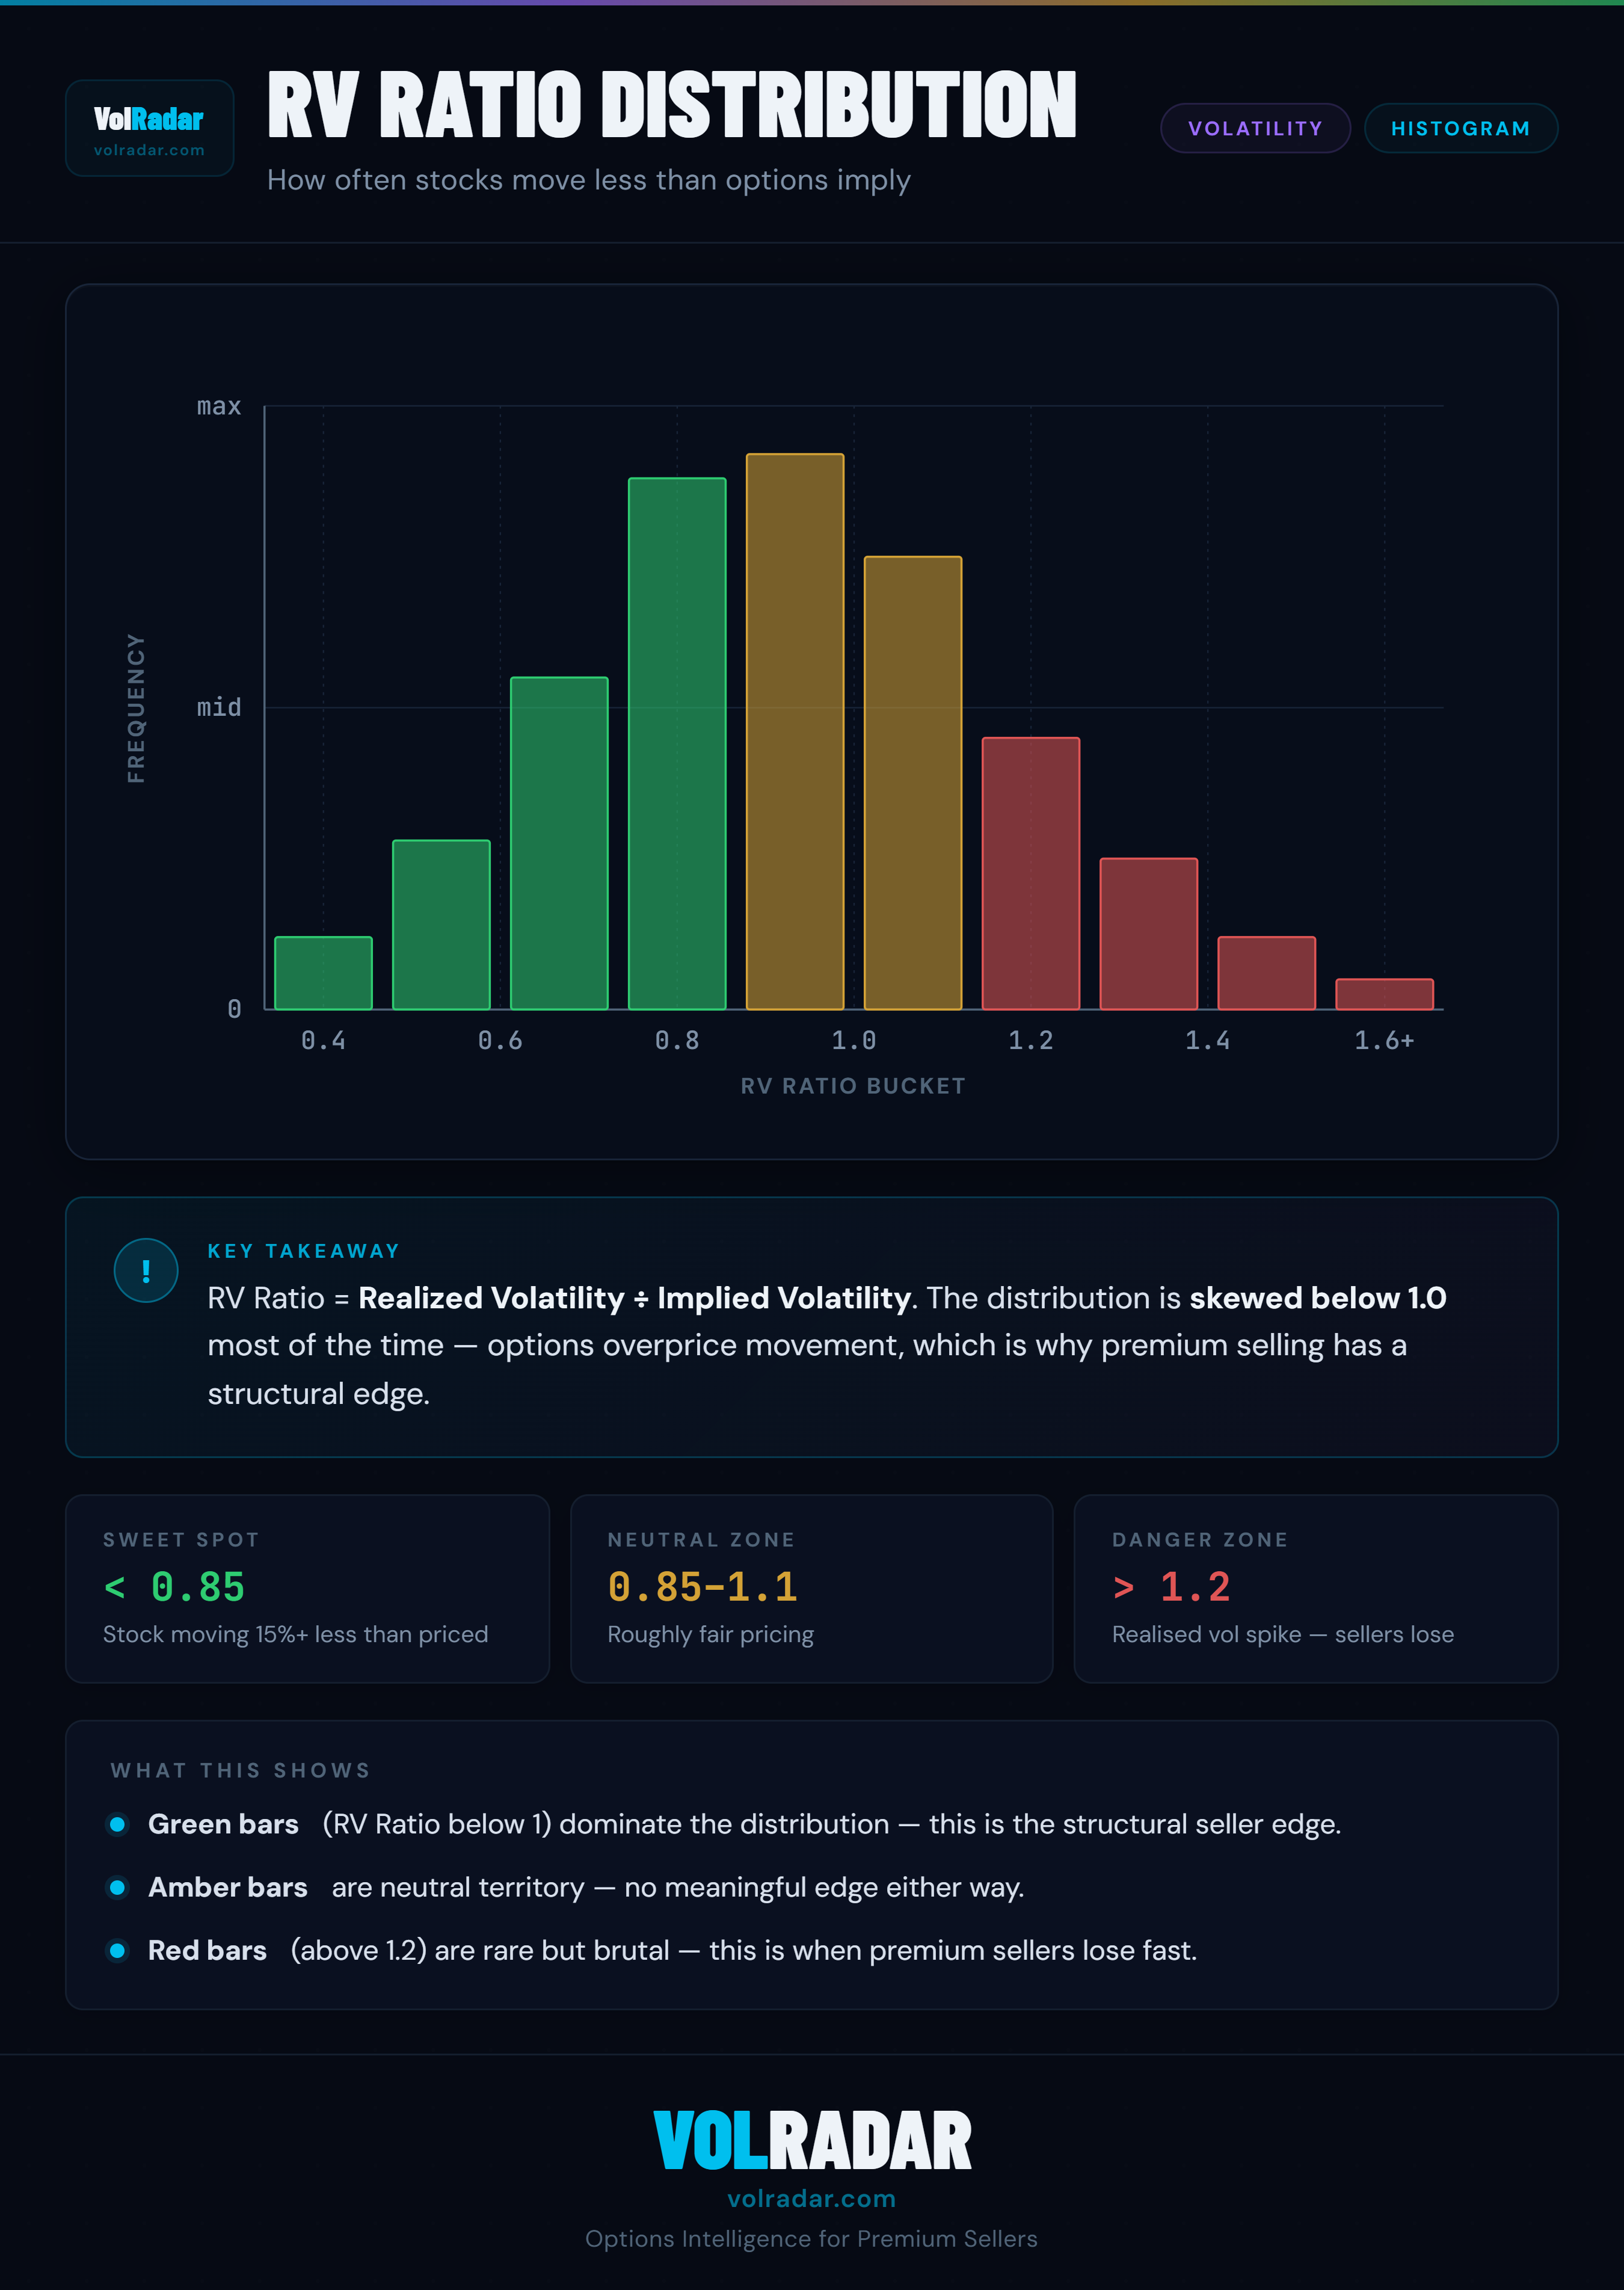
Reading the signal
Below 0.7: very favourable — stock is exceptionally calm vs what options imply. 0.7–0.85: good conditions for selling premium. 0.85–1.0: neutral, be more selective. 1.0–1.2: realised is matching implied, reduce size. Above 1.2: vol spike territory — stock is moving more than priced in, skip new short premium positions until it normalises. These thresholds apply across most large-cap stocks but differ for high-beta names.
RV Ratio vs VRP
RV Ratio and VRP measure the same underlying relationship in different forms. VRP is the difference (IV − RV) in percentage points; RV Ratio is the ratio (RV / IV) as a number around 1.0. Both use identical inputs (HV 20d and IV 30d). A low RV Ratio always corresponds to positive VRP. Which to prefer? VRP is easier for threshold-based rules ("VRP above +2pp"). RV Ratio is easier for cross-stock comparison because it normalises absolute vol levels.
Using RV Ratio in practice
The best premium selling setups combine a low RV Ratio (below 0.85) with positive VRP and no upcoming earnings. A low RV Ratio tells you the gap is wide enough to matter. VolRadar's scanner sorts all 500+ S&P 500 tickers by RV Ratio ascending, surfacing the calmest stocks first. Filter for RV Ratio below 0.85, IV Rank above 40, and no earnings within 14 days to find the cleanest setups.